You are using an out of date browser. It may not display this or other websites correctly.
You should upgrade or use an alternative browser.
You should upgrade or use an alternative browser.
The D.I.Y. ZD30 remap thread.
- Thread starter Rumpig
- Start date


Help Support Nissan Navara Forum:
This site may earn a commission from merchant affiliate
links, including eBay, Amazon, and others.
camo.b
Member
Nice work! What kw gains were you getting from the meth injection .... 20kw if i calculate correctly
a 5 gph is fairly big. a 10 gph is more than likely way to big.
camo.b
Member
I get a bit of a rattle on gear changes with a 9.5gal nozzle @100% but nothing major.
In summer i was running a 15 gal at about 80% duty cycle with no rattle...as it got colder down here the rattle came back
Both those were a 50/50 mix
In summer i was running a 15 gal at about 80% duty cycle with no rattle...as it got colder down here the rattle came back
Both those were a 50/50 mix
Mitchy
Member
Correct me if I'm wrong but the torque values for the remap 15psi are actually 270Nm while the 17psi is 280Nm so there is a difference in torque along with the 3.6kw increase. What effect did the boost have on egt's? I'm guessing it would have decreased a little with higher boost?'
Also the power figures that aftermarket chips claim of 110kw stock and 315Nm and with chip up to 380Nm and 130kw, I'm assuming that is at the fly wheel. So how do the figures your getting with a remap compare to what a chip claims to be able to achieve??
Also the power figures that aftermarket chips claim of 110kw stock and 315Nm and with chip up to 380Nm and 130kw, I'm assuming that is at the fly wheel. So how do the figures your getting with a remap compare to what a chip claims to be able to achieve??
ShortyNavros
Member
Without using the same car on the same dyno and switch between the remap and chip to see the difference. Otherwise you would be comparing apples with oranges, too many variables between different cars
bods
Member
As far as power and torque output claims go, generally there is a 30% driveline loss, so rumpigs figures quoted at the wheels, work on 30% more than that at the motor... this also varies with different gearing and different sized tyres, so you'd have to check what he's running as far as that goes tooCorrect me if I'm wrong but the torque values for the remap 15psi are actually 270Nm while the 17psi is 280Nm so there is a difference in torque along with the 3.6kw increase. What effect did the boost have on egt's? I'm guessing it would have decreased a little with higher boost?'
Also the power figures that aftermarket chips claim of 110kw stock and 315Nm and with chip up to 380Nm and 130kw, I'm assuming that is at the fly wheel. So how do the figures your getting with a remap compare to what a chip claims to be able to achieve??
Correct me if I'm wrong but the torque values for the remap 15psi are actually 270Nm while the 17psi is 280Nm so there is a difference in torque along with the 3.6kw increase. What effect did the boost have on egt's? I'm guessing it would have decreased a little with higher boost?'
Also the power figures that aftermarket chips claim of 110kw stock and 315Nm and with chip up to 380Nm and 130kw, I'm assuming that is at the fly wheel. So how do the figures your getting with a remap compare to what a chip claims to be able to achieve??
You're correct with the difference between 15 and 17psi, but with the added boost I added a bit more fuel so the temps are the same. I haven't tried to convert rear wheel to flywheel figures (which is what manufactures quote) but it would be 25-30%, what ever that works out to.
I'll start posting on the maps that are changed in this 15psi base map file from the last dyno run but should start with the usual disclaimer.
Anyone can use these bin files but should do so at their own risk. The ZD30 does have a reputation for self destructing (more so 2003 and earlier in the Navara). You should know the history of your car service wise, and be certain it is in good condition before modifying it in any way. This remap is done with a standard condition car in mind and should be safe for use on a stock Navara. Adding a better exhaust and an intercooler will provide a better margin of safety.
Anyone can use these bin files but should do so at their own risk. The ZD30 does have a reputation for self destructing (more so 2003 and earlier in the Navara). You should know the history of your car service wise, and be certain it is in good condition before modifying it in any way. This remap is done with a standard condition car in mind and should be safe for use on a stock Navara. Adding a better exhaust and an intercooler will provide a better margin of safety.
Attachments
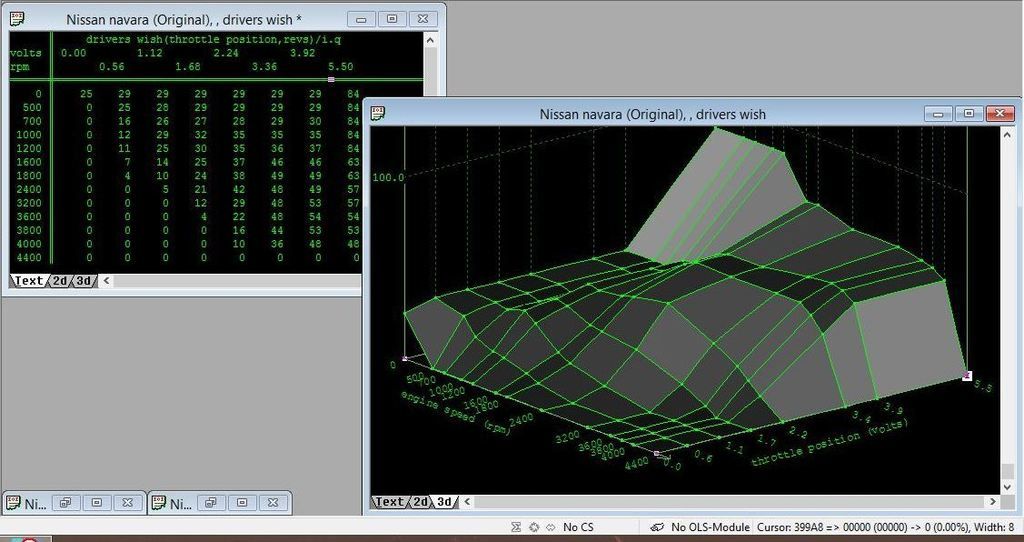
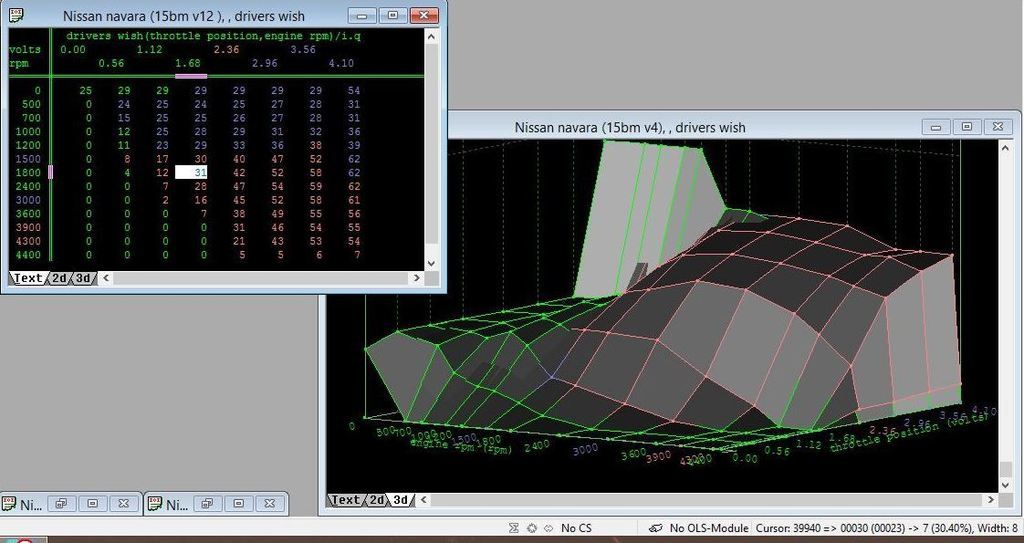
Driver Wish Maps.
The Drivers wish map is the one that will have the most effect over the drivability of our car, this one affects pedal response the most. The axis are rpm and throttle position measured as volts with the output being fuel in milligrams.
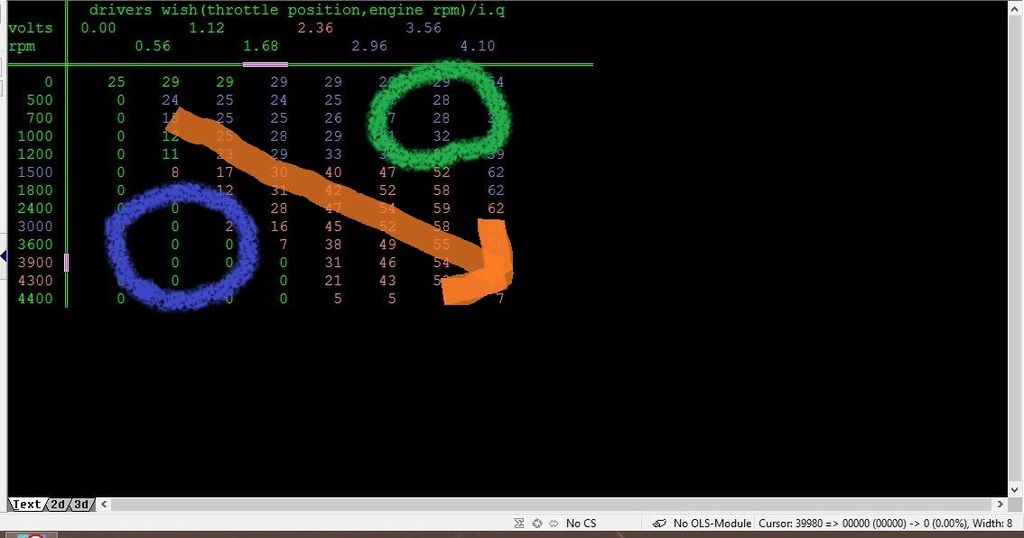
The orange arrow shows where the map is mainly being used, increasing revs and increasing pedal position, and is where the map is mainly changed. The two circled areas aren't where you wouldn't normally operate, high pedal position-low revs and low pedal position- high revs and don't need to be changed much. Adding fuel in the green circled area just gave me smoke down low and in the orange area when you take your foot of the pedal fuel is cut by the ecu as a fuel saving measure so can be left as zeros.
As well as adding fuel in the map you can also change the values on the axis. Where you generally drive which is in the 1500-2500 rpm range and around the 1-2.5 volt area the lines are closer together which gives more accuracy to changes in pedal response. The original map went to 5.5 volts but logging with ecutalk i've never seen more than 4.08v which is why I changed it to 4.1. The maps don't just use the fixed values in the maps, they do calculate values in between what are shown.
The Drivers wish map is the one that will have the most effect over the drivability of our car, this one affects pedal response the most. The axis are rpm and throttle position measured as volts with the output being fuel in milligrams.


The orange arrow shows where the map is mainly being used, increasing revs and increasing pedal position, and is where the map is mainly changed. The two circled areas aren't where you wouldn't normally operate, high pedal position-low revs and low pedal position- high revs and don't need to be changed much. Adding fuel in the green circled area just gave me smoke down low and in the orange area when you take your foot of the pedal fuel is cut by the ecu as a fuel saving measure so can be left as zeros.
As well as adding fuel in the map you can also change the values on the axis. Where you generally drive which is in the 1500-2500 rpm range and around the 1-2.5 volt area the lines are closer together which gives more accuracy to changes in pedal response. The original map went to 5.5 volts but logging with ecutalk i've never seen more than 4.08v which is why I changed it to 4.1. The maps don't just use the fixed values in the maps, they do calculate values in between what are shown.
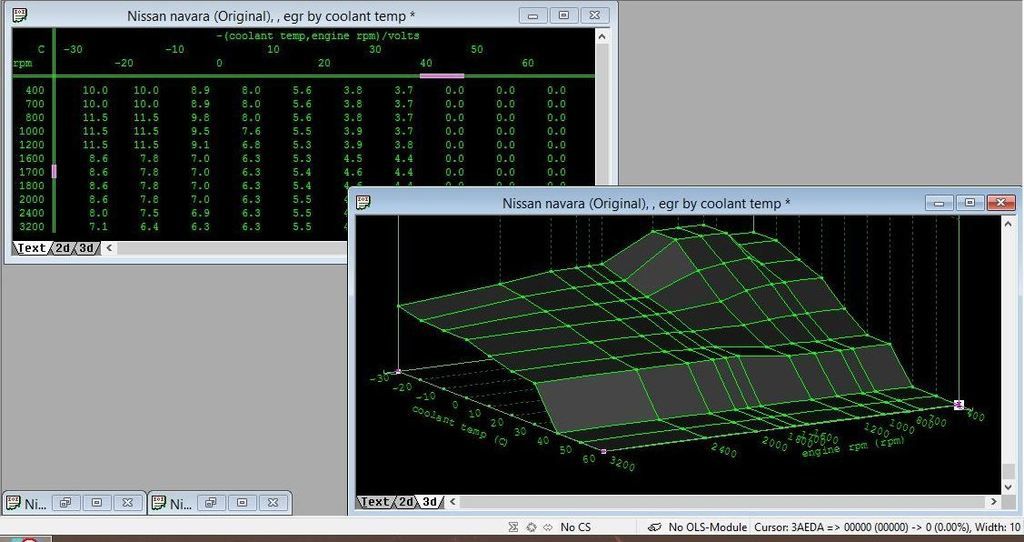
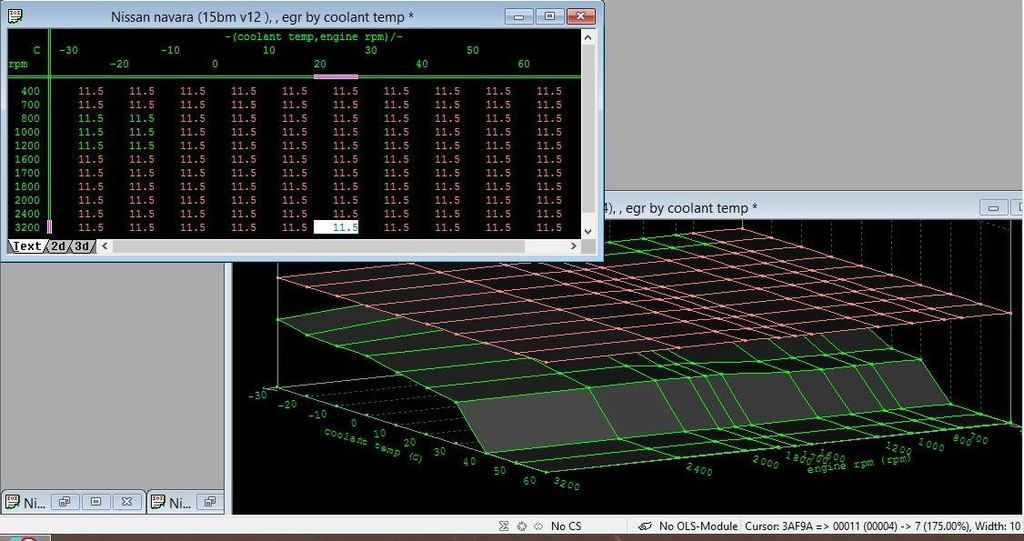
Exhaust Gas Recirculation.
Axis are rpm and coolant temp with the output being egr valve position in volts.
After reading the D22 Manual to find out what conditions the EGR system operates under, I identified this map as the one which controls it by the coolant temp. It doesn't operate at low rpm or low coolant temperatures so the value (11.5) at this part of the map is obviously the off position. Setting the entire map to 11.5 means that the EGR won't operate at all. When the EGR does operate, it has to remove fuel because the engine is being flooded with exhaust gas and would be running rich, turning it off prevents this. This explains some off the lack of power and pedal response as it is mostly operating in the mid rpms, where you normally drive. Most of the gains are achieved just by turning this off and modifying the Drivers wish.


Last edited:
ShortyNavros
Member
Nice explanation rumpig. Cheers
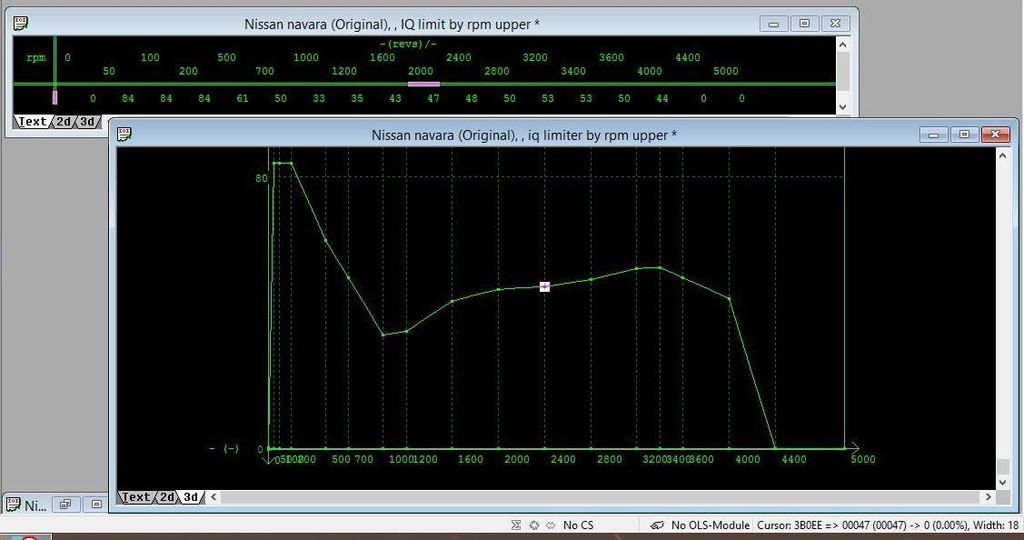
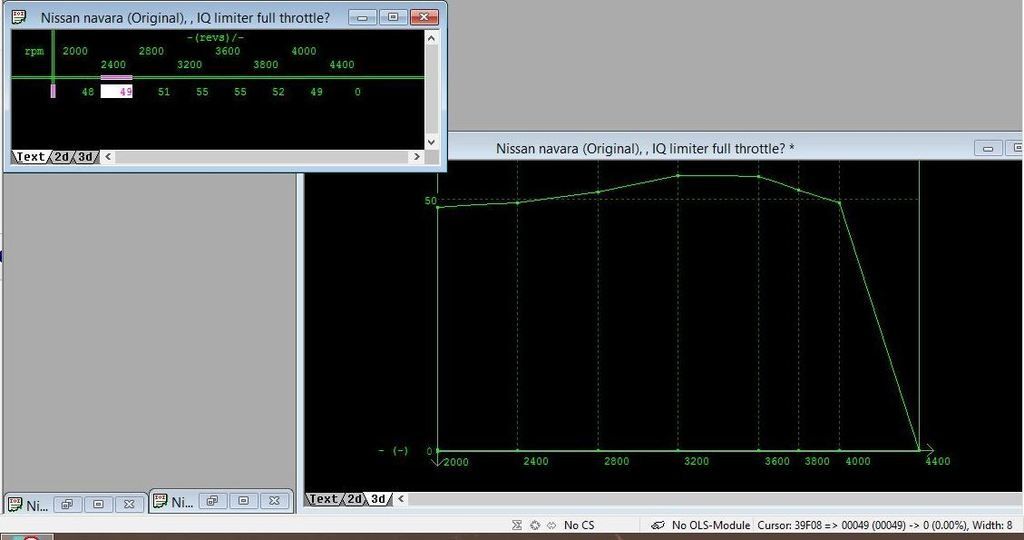
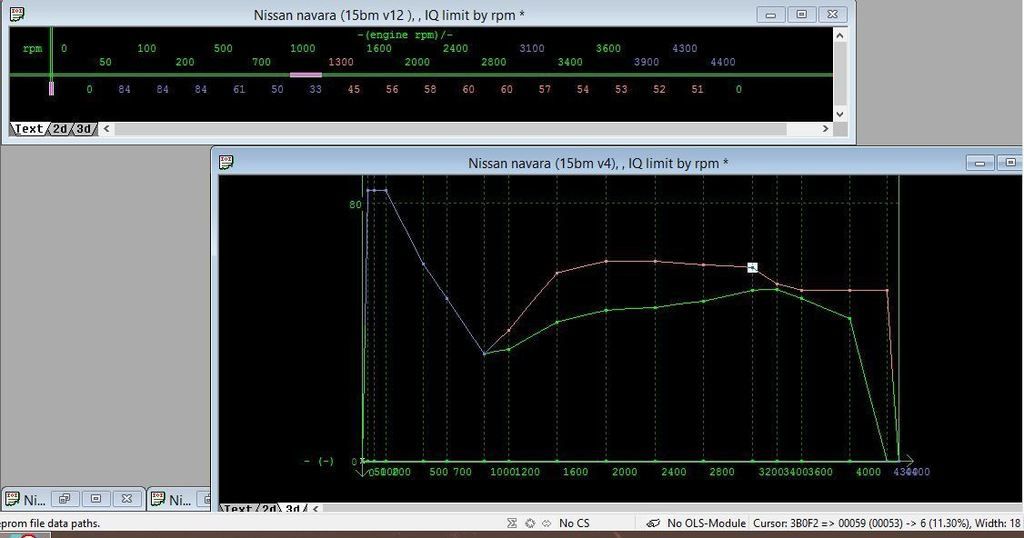
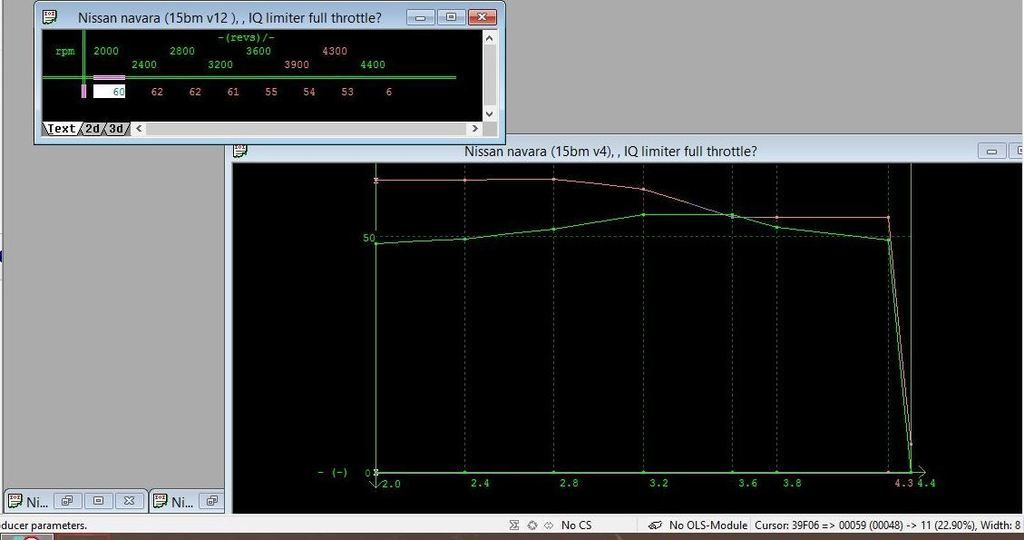
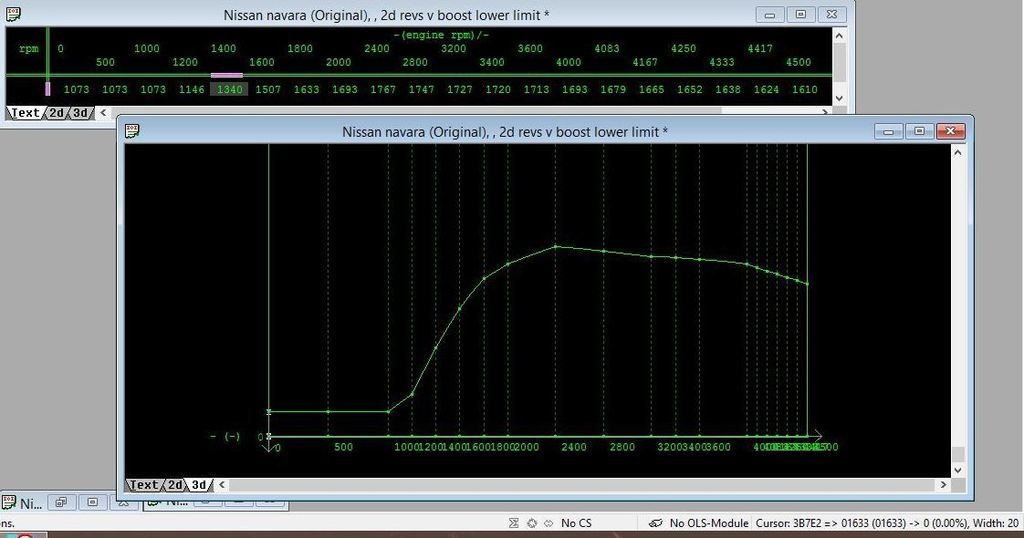
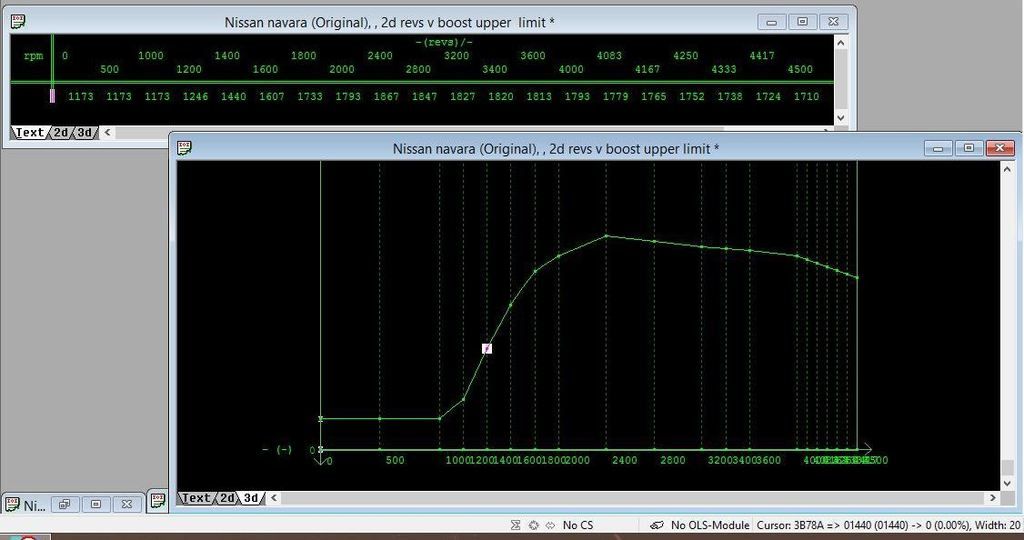
Toque Limiter.
The torque limiters are 2 dimensional maps not 3D. The axis is rpm with the output being fuel in mg.
Newer ecu's measure output in newton metres with an "injection quantity to newton metre" conversion map, but all the torque limiters in our ecu are just fuel based and limit the fuel at certain rpms. You'll notice that the torque limiter curves resemble the torque curves on the dyno charts posted earlier. The first pic is the main torque limiter and the second one I believe is for Wide Open Throttle, as it only starts from 2000 rpm and there is a switch on the accelerator pedal for W.O.T ( which also temporarily switch the aircon off for more power).


Nice explanation rumpig. Cheers
Thanks.
I failed English more than once so i'm struggling.
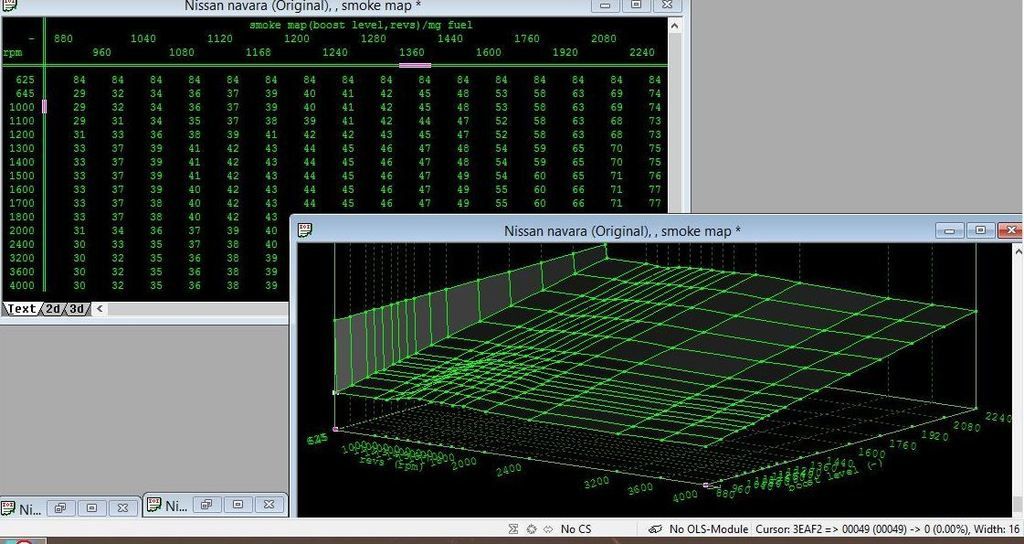
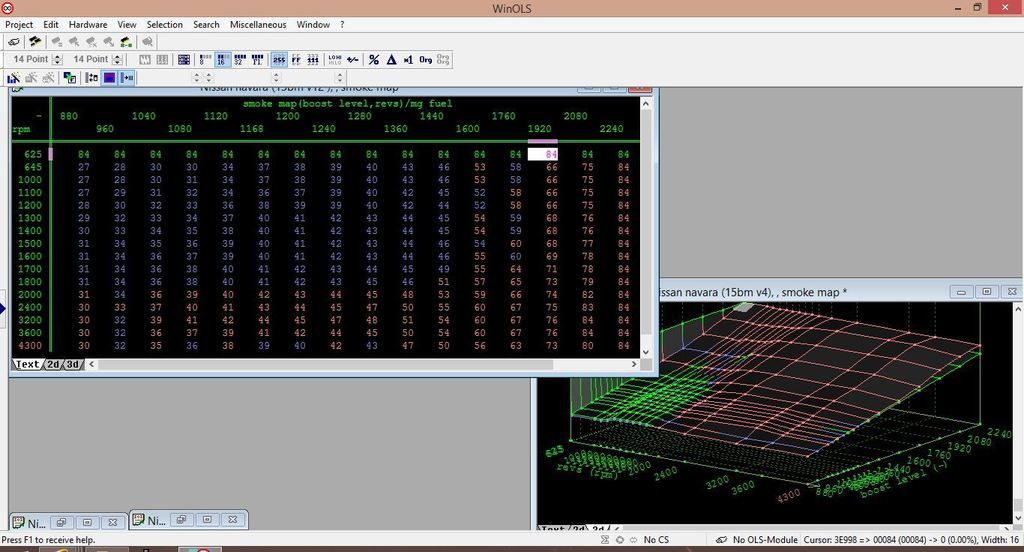
Smoke Map.
Axis are rpm and boost level in Mbar.
This map limits fuelling dependant upon the level of boost. Once you start getting richer than around 17-1 you start getting more smoke hence the name. There's a bit of math that goes in to working out the Air fuel ratio as you have to allow for things like air density, volumetric efficiency and air temp. I lowered fuel settings down low from standard to clean up the smoke I was getting and raised them higher up as they were pretty conservative.


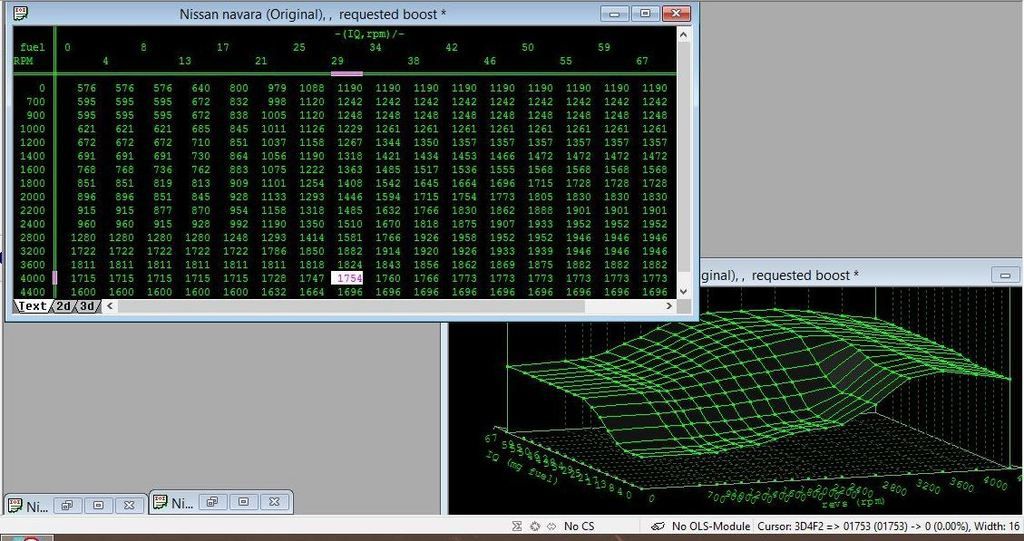
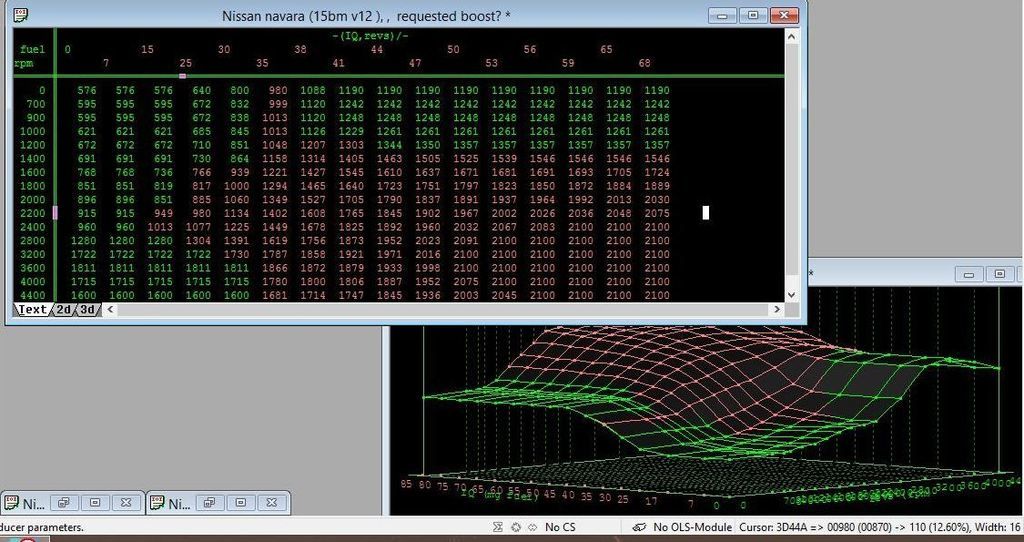
Requested boost.
Axis are rpm and fuel in mg with the output being boost pressure in mbar.
This map is what the ecu expects the boost pressure to be at certain rpm and fuel levels. There are also two, 2 d maps, one which is around 50mbar lower and another that is around 50 mbar higher. I believe that if requested boost falls outside these ranges then it will throw codes for high or low boost. I log the boost levels on ecutalk and then plot those levels in this map and keep the corresponding 2d maps 50 mbar either side of the changes.


Similar threads
- Replies
- 6
- Views
- 1K